
Finish the report before you leave the bridge.
Each structure comes up on your tablet as a simple drawing, or a 3D model you can walk round. Tap where the defect is, give it a condition state, take a photo, and keep going. Bridges, culverts, sign gantries, retaining walls, noise walls and plenty more. When you're done, the PDF report and Excel register come straight off the device, signal or not.
What it does
It's set up for a routine or condition inspection, with a tablet in one hand while you're standing on the embankment.
Diagrams from your structure list
Import your list from Excel or CSV. If it has spans, deck width, planks or girders, pier types or culvert cells, each diagram is drawn for you.
Tap where the defect is
Tap the pier, span, girder or wingwall on the elevation, plan or section. The defect is pinned there, and the app notes which face it's on.
Walk round it in 3D
Every bridge and culvert also comes as a 3D model. Orbit it, look underneath, and tap any part to log a defect. Pins show in 3D and on the drawings.
More than bridges
Sign gantries, crane pads, retaining walls, noise walls, barrier runs, pits, towers and more: over 30 kinds, each with its own drawing and component list. Or pin defects on your own photo, PDF drawing or sketch.
Photos that keep their details
Take photos with the tablet's camera. Each one keeps its date, time and GPS position, stays with its defect and turns up in the report. Full-size originals can go to the gallery too.
Condition states and treatments
Rate each defect CS1 to CS4, pick a treatment and a priority, and get a rough cost if you've put in your own rates.
Public safety risk
Rate each hazard on a likelihood and consequence matrix. The highest risk shows on the inspection and in the report.
Your own fields and formulas
Add the extra things you collect, such as remaining life with a renewal year worked out for you, or a GPS location that shows how far along a wall each defect is. Limit a field to the kinds of structure that need it.
Reports your way
PDF reports are made on the device. Set your own header, logo and colours, choose the blocks and their order, and keep several templates. Batch exports go out as a zip with a folder for each structure, and defects go to an Excel register.
Your own defect lists
Each project has its own components, defects and treatments. Edit them in the app, or in Excel and load them back in.
Fix the layout on site
If a structure doesn't match its drawing, the inspector can change it on site and keep going. A team admin approves the change later.
Map and trip planning
See your structures on a map, find the closest ones, and plan a few days of inspections with Google Maps links for each day.
Works with no signal
It installs from the browser and works fine under a bridge in the middle of nowhere. Map tiles you've already looked at are kept for offline use.
Guides built in
Plain-English guides for inspectors on site and for admins setting things up, written for phone, tablet and laptop. Open them from the menu any time, offline too.
Sync if you want it
Sign in to back up and share team projects, photos included. Admins set up projects and layouts, and inspectors do the inspections. Projects you keep on the device stay there.
See it in action
Short clips recorded in the app. Watch the whole walkthrough
Set up a project in a minute. Create the project and import your structure list. Diagrams are drawn from the layout columns.
Draw the layout as you type. Spans, girders, piers, skew, approach guardrail and which way the road goes. Other structures get their own drawing.
Tap where the defect is. Pick the defect, condition state, size and treatment, then walk round it in 3D.
Finish and the report is done. Rate it, add your summary, mark it complete. The PDF comes straight off the device.
Here's how it looks on an iPad
These come from the sample project that's built into the app.
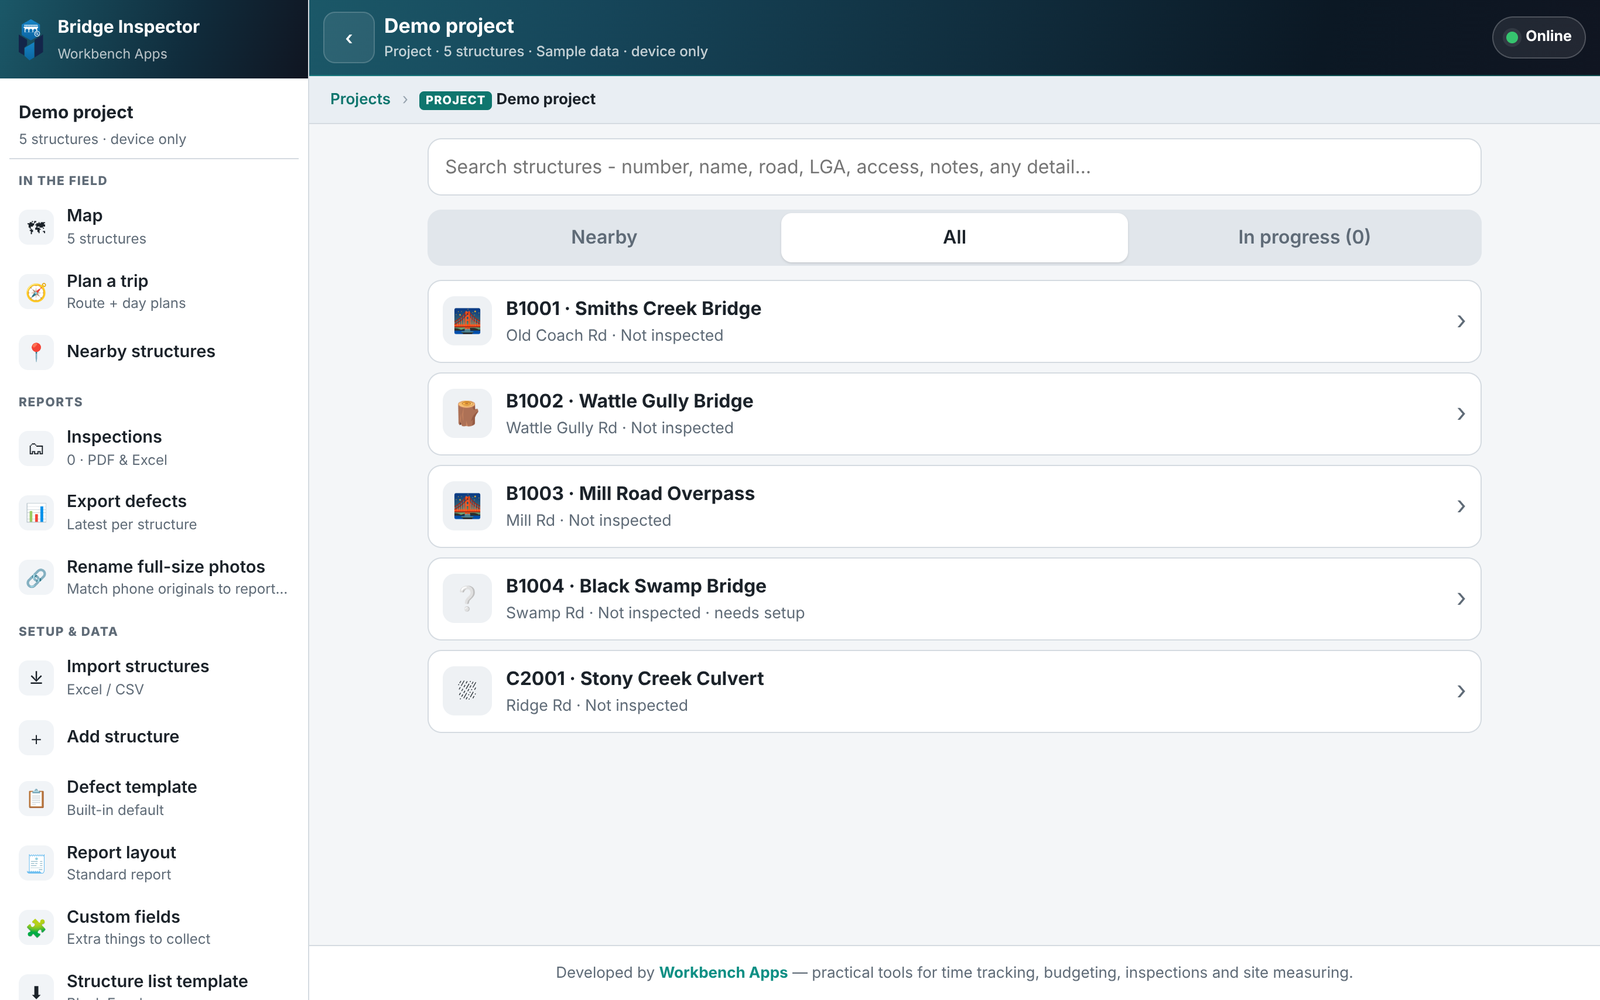
Project screen. Field tools, reports and setup on one menu, and a structure list you can search.
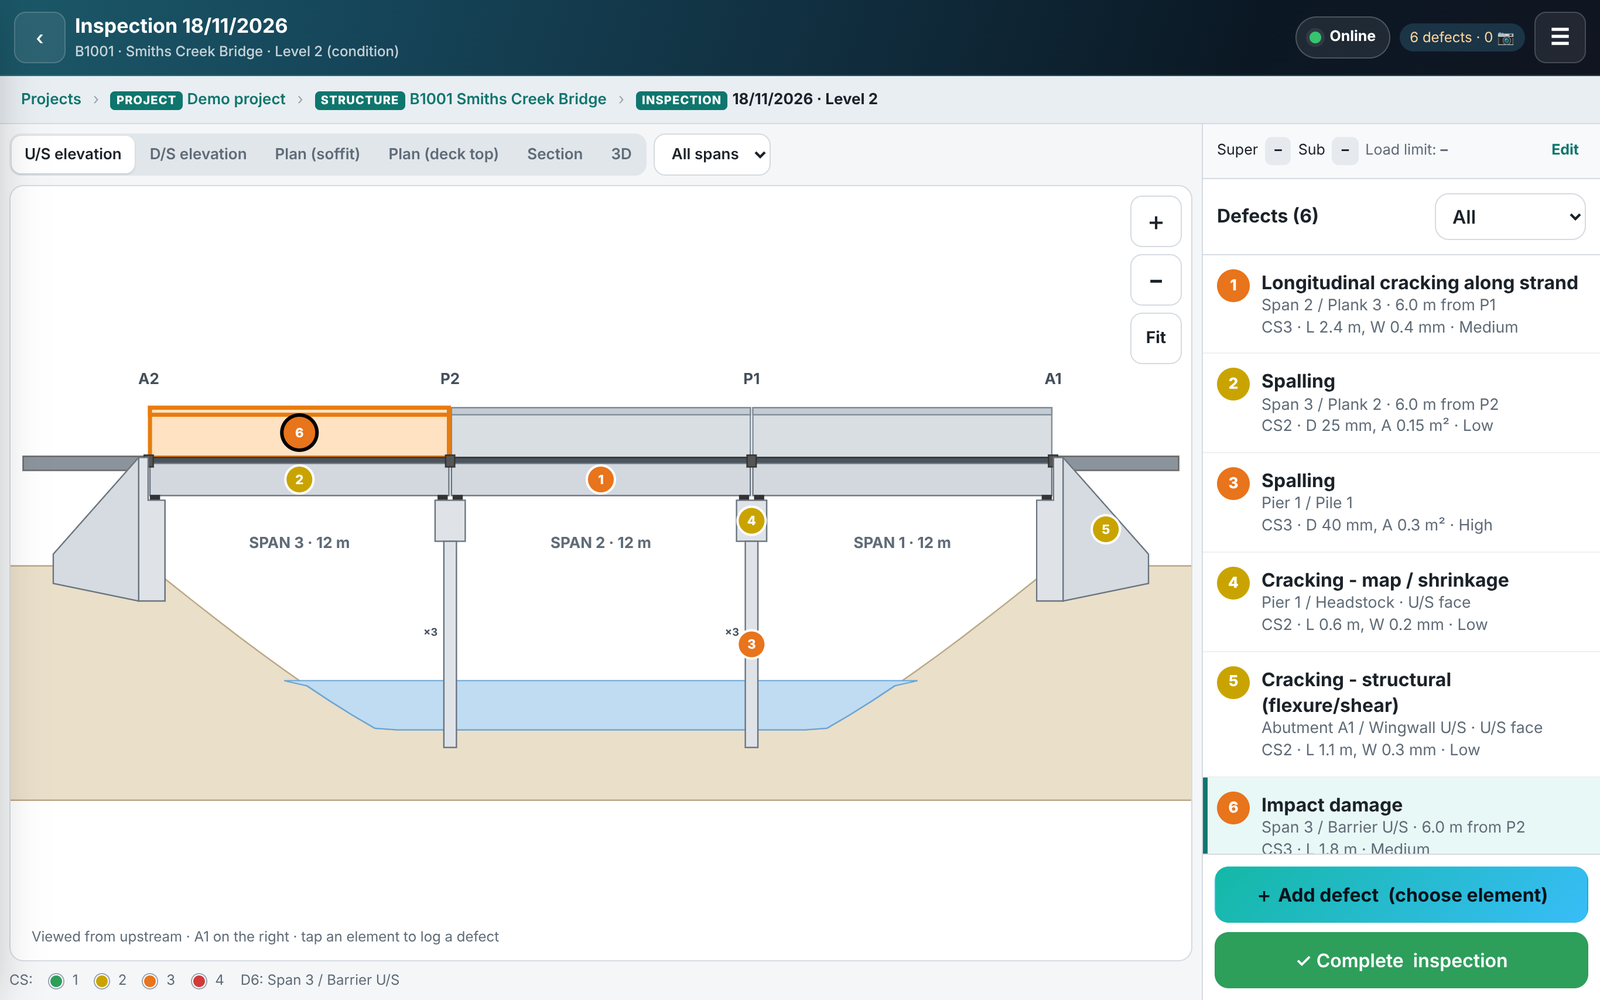
Inspection screen. Elevations, plans and sections, with pins coloured by condition state and the defect list alongside.
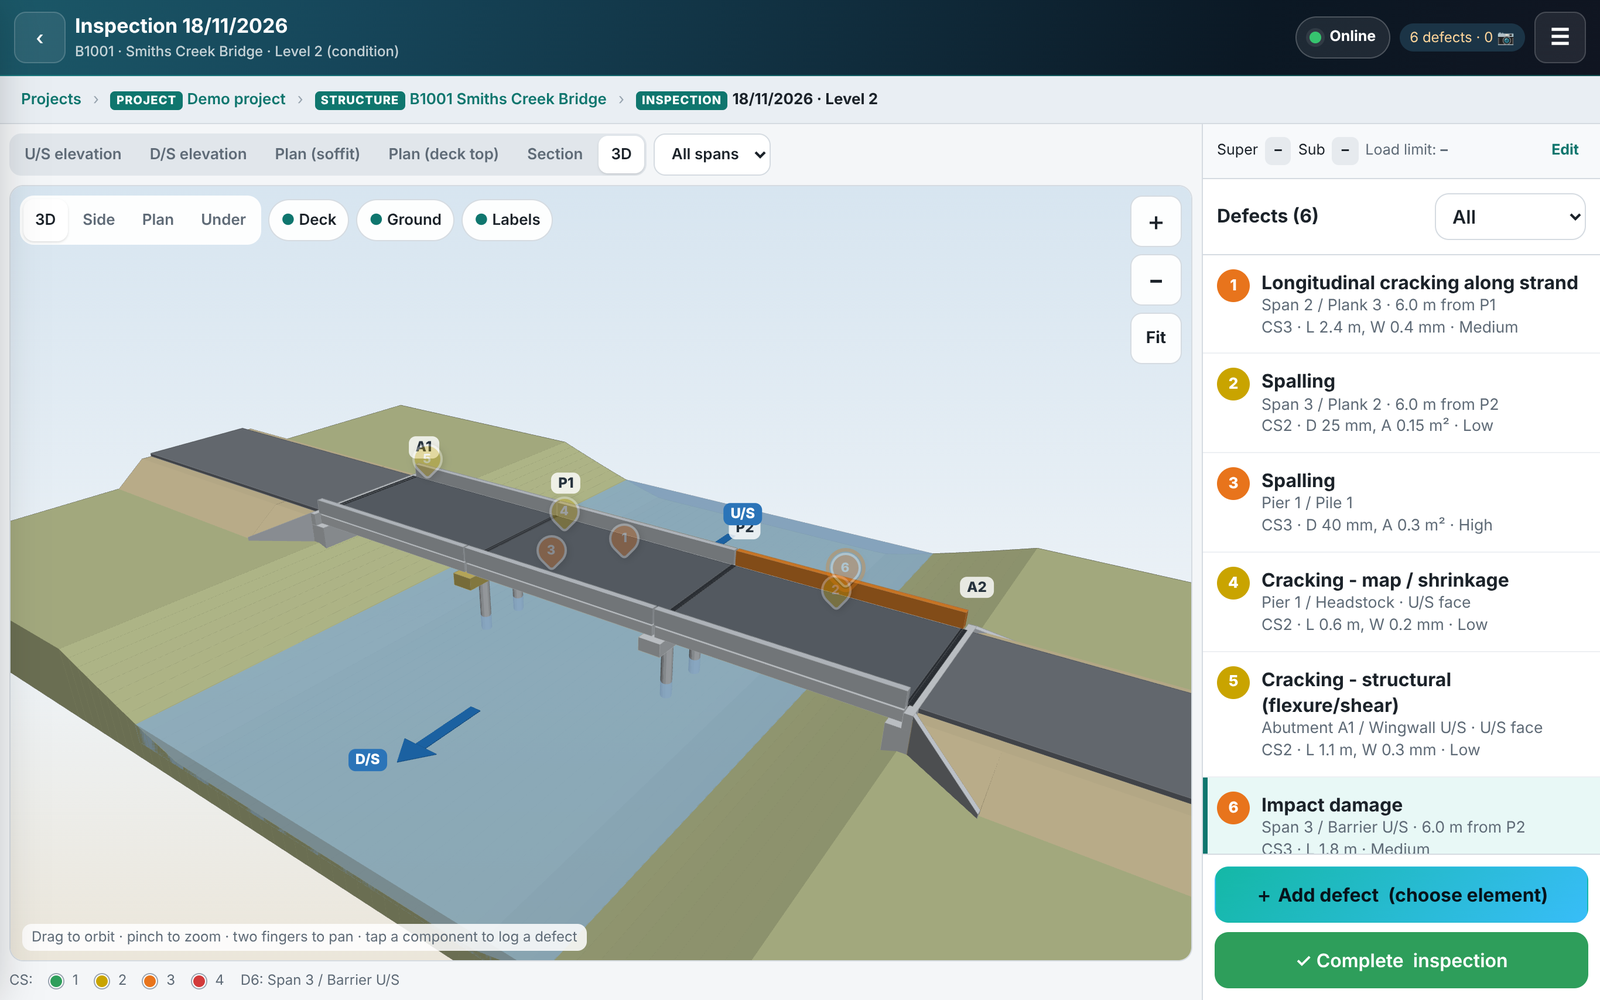
3D view. Orbit the model and tap a part to log a defect. Hide the deck or ground to get at what's underneath.
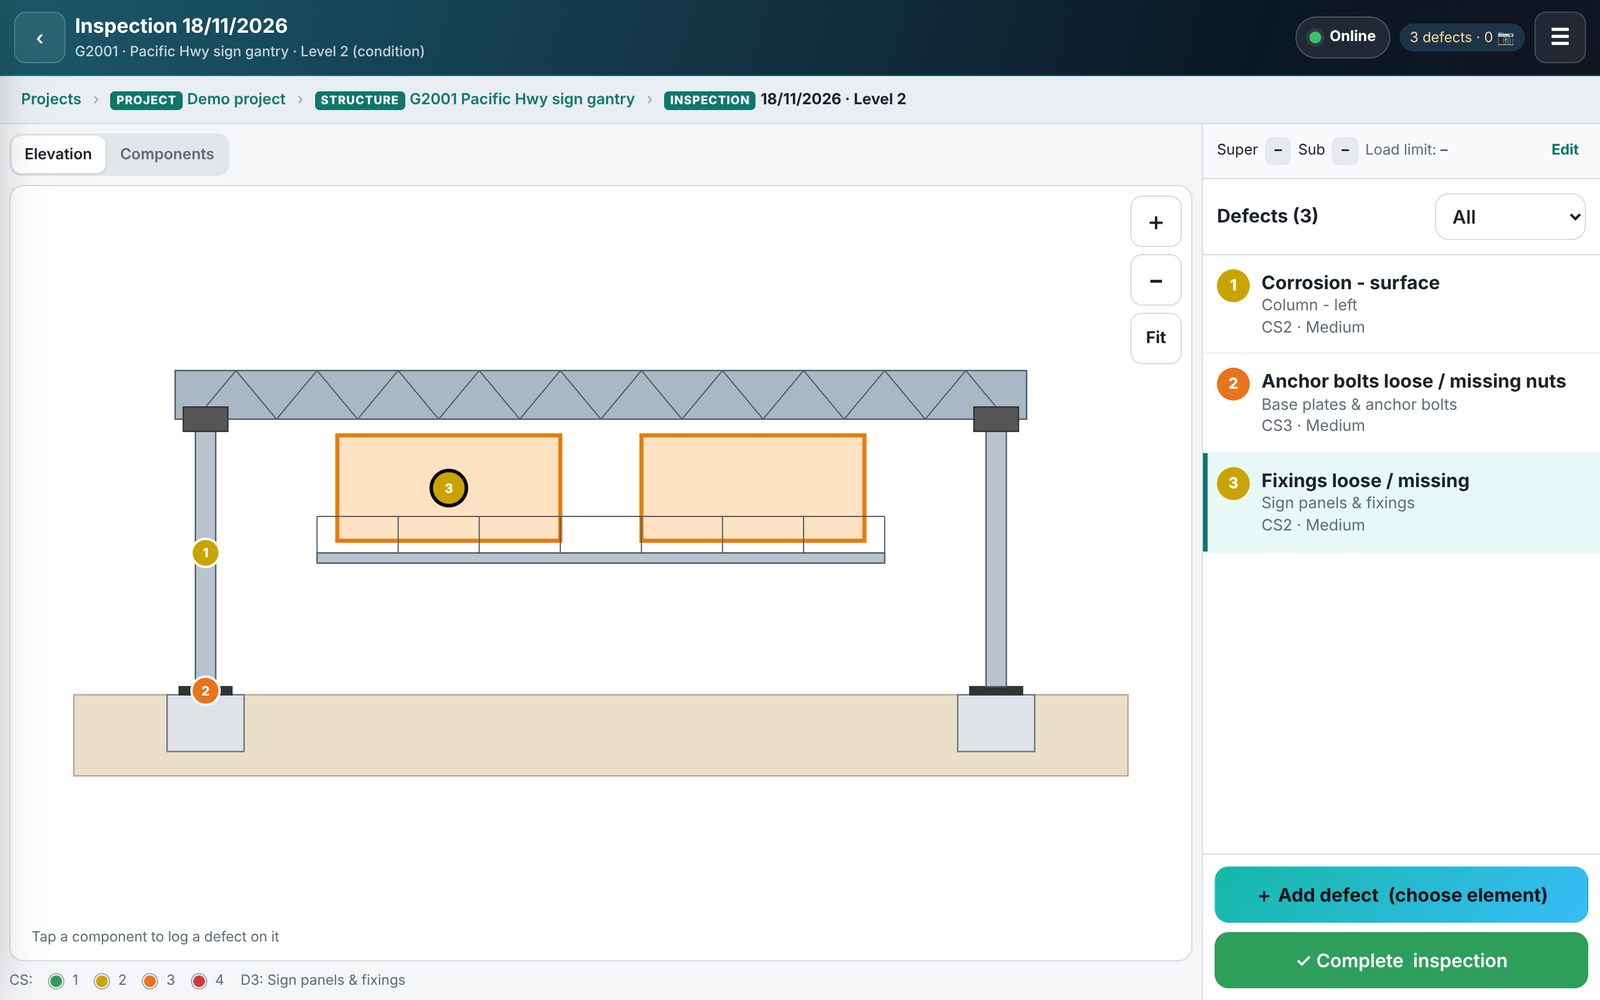
Other structures. A sign gantry with its own drawing. Tap a column, base plate or sign panel to log a defect.
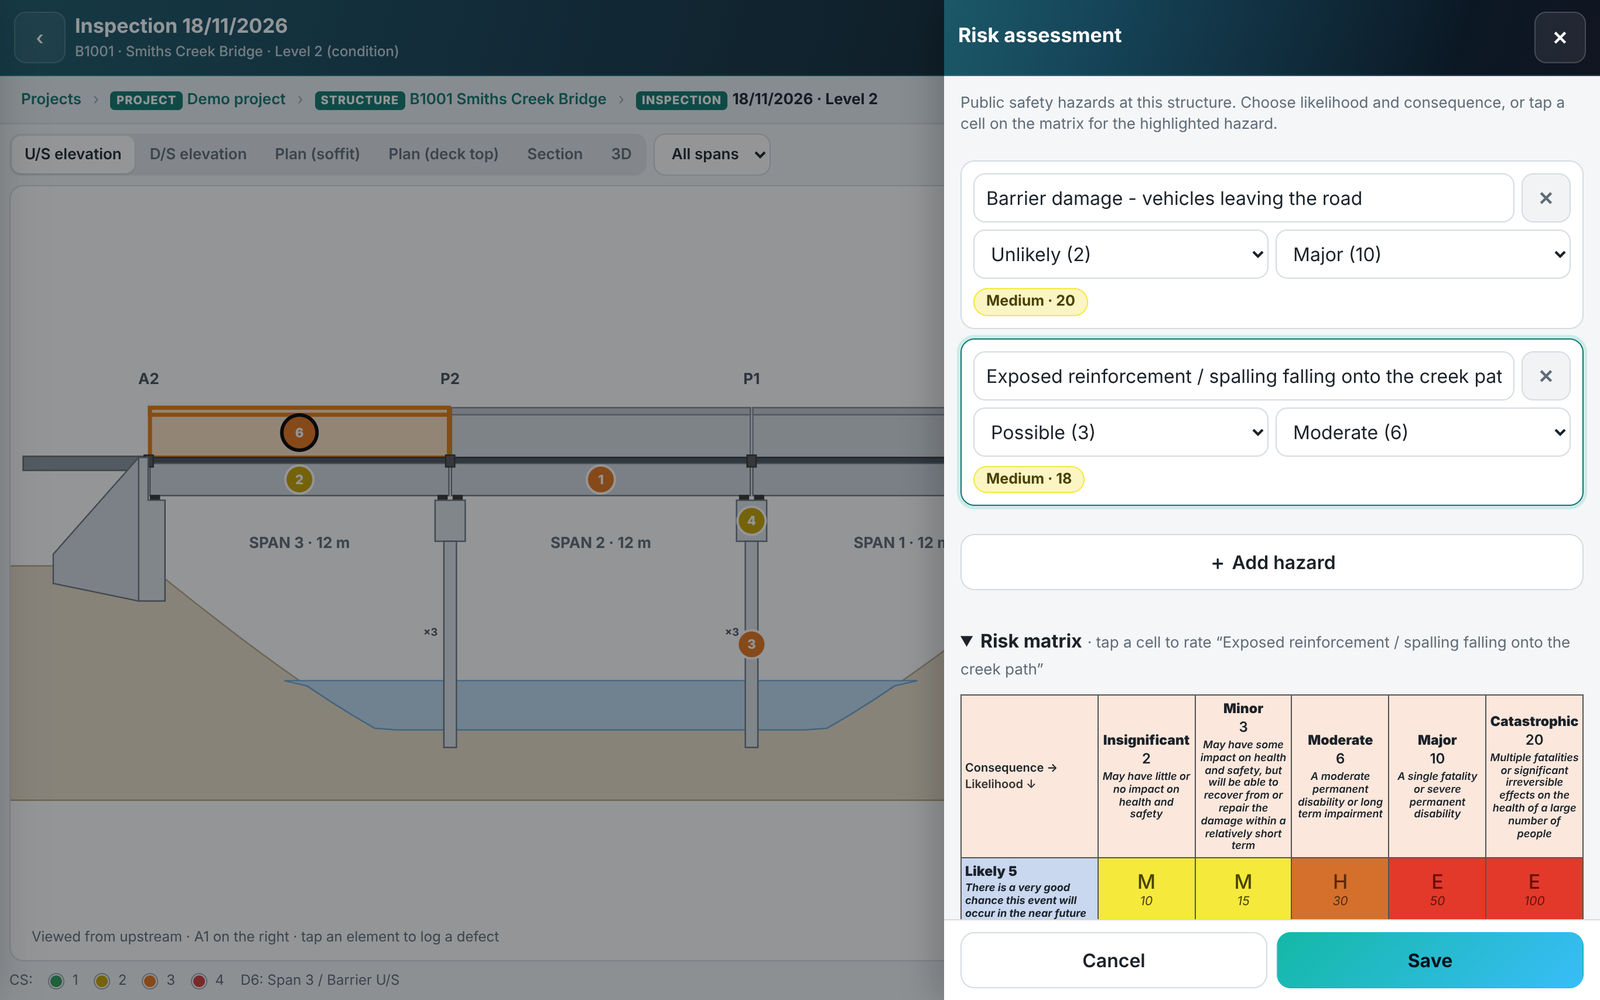
Risk assessment. Hazards rated on the risk matrix, with the highest risk carried through to the report.
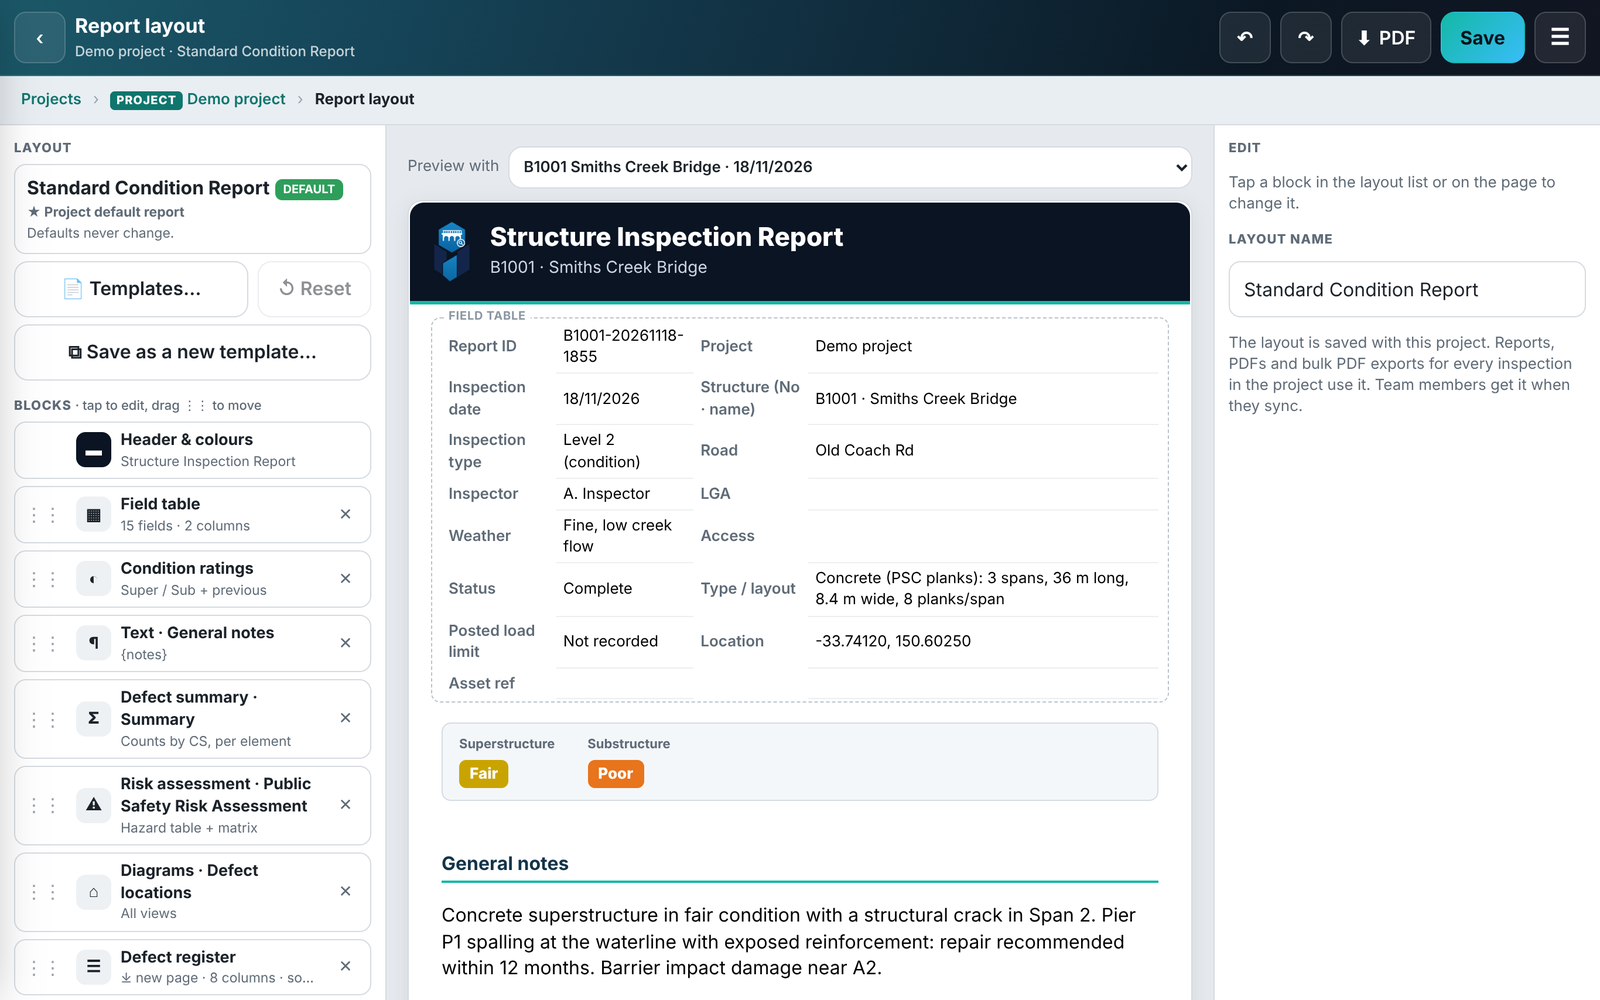
Report designer. Your header and colours, and the blocks you want in the order you want them, previewed as the PDF.
How it works
Everything is grouped by project, then structure, then inspection.
Set up a project
Make one for each client or program, load in the structure list, pick a defect list (or adjust one) and set up your report.
Inspect on site
Open the structure, start an inspection and tap your way round it on the drawing or in 3D, adding defects, ratings, photos and the risk.
Finish and report
Mark it complete. The app checks you haven't missed a rating, then makes the PDF report and Excel register.
See what you'd hand over
The walkthrough video goes from structure list to finished report in about two minutes, and the sample report shows exactly what comes out the other end.